

To prepare for the Project Management Professional (PMP)® examination, candidates must master the Process domain task “Develop an integrated project management plan and plan delivery.” A foundational enabler of this task is “Assess project needs, complexity, and magnitude.”
Before writing an integrated project plan or selecting a development life cycle, a project manager must conduct a systematic “Phase 0” assessment. A rigid “one-size-fits-all” methodology fails because projects differ fundamentally in what they aim to achieve, how complex their execution environment is, and how large or critical their scope is. Assessing these three dimensions establishes the foundation for tailoring governance, selecting a delivery approach (Predictive, Adaptive, or Hybrid), and building a balanced project management plan.
1. Dimension 1: Assessing Project Needs
Projects do not exist in a vacuum; they originate from unmet organizational needs—either to resolve a critical business problem or to capture an untapped strategic opportunity.
A. Business Value vs. Output
Modern project management standardizes project success around delivering expected business value rather than simply adhering to rigid baseline constraints of time, budget, and scope. While traditional metrics evaluate outputs (e.g., delivering a software system on schedule), value-driven management evaluates outcomes (e.g., whether that software system actually generates revenue, improves operational efficiency, or reduces risk). If an integrated plan is built without aligning deliverables to business value, the project risks delivering a “successful” output that provides zero organizational benefit.
B. Conditions of Satisfaction (COS) & Wants vs. Needs
During initial scoping, project managers must distinguish between stakeholder wants and true business needs:
- Wants: How stakeholders imagine or desire a solution to look, which often inflates scope and cost without adding proportional value.
- Needs: The essential capabilities and requirements required to solve the underlying business problem or achieve the target objective.
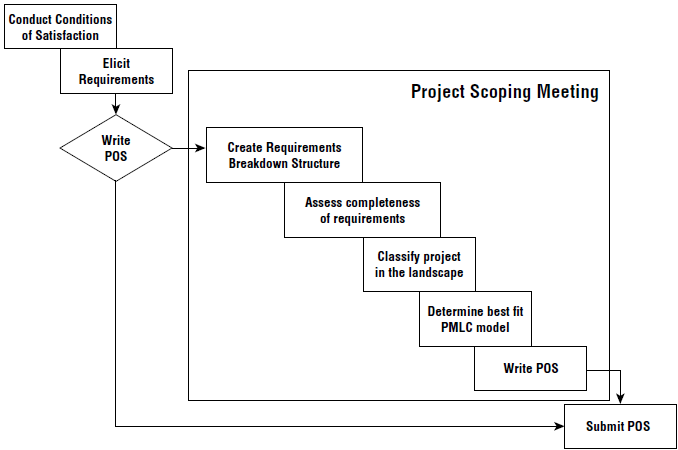
To align expectations, project managers conduct Conditions of Satisfaction (COS) sessions with key stakeholders to establish clarity of purpose, define measurable business outcomes, and set boundaries before deep planning begins.
C. Requirements Elicitation & Decomposition Frameworks
To structure project needs without becoming overwhelmed by thousands of low-level details at the outset, project managers apply hierarchical decomposition tools:
- Requirements Breakdown Structure (RBS): High-level business needs are captured into a manageable set of core requirements (typically 8 to 12 at project initiation). As the project progresses, these high-level requirements are progressively elaborated and decomposed into functions, sub-functions, processes, activities, and features.
- Value Breakdown Structure (VBS): Maps the project scope directly to the economic or strategic value each deliverable generates. Assigning value estimates or percentages to WBS/RBS components helps prioritize backlog items, justify critical path decisions, and identify non-value-added work.
2. Dimension 2: Assessing Project Complexity
Complexity characterizes a project or its operating environment that is difficult to manage due to human behavior, system interdependencies, technical innovation, and ambiguity. Assessing complexity enables project managers to determine how much flexibility and process structure the project requires.
A. The Scope Triangle as a System in Balance
Unlike the traditional 3-variable “Iron Triangle”, modern complex project management evaluates a 6-variable Scope Triangle:
- Scope & Quality: Placed at the center, representing the functional requirements and deliverable standards.
- Bounding Variables (Time, Cost, Resource Availability): Form the outer equilibrium system controlled by project managers, clients, and management.
- Risk: Encompasses all internal and external variables, directly impacting the stability of the entire system.
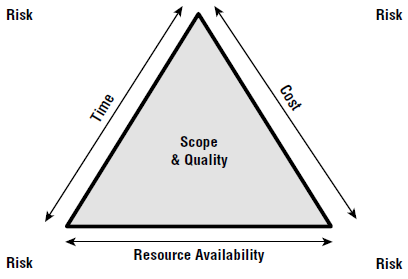
When one variable changes (e.g., a customer requests additional scope), the system falls out of equilibrium. Balance must be restored by adjusting time, cost, or resource availability, or by making explicit trade-offs across prioritized variables using a Project Impact Statement (PIS).
B. The 4-Quadrant Project Landscape
To simplify life cycle selection, Robert Wysocki categorizes all projects across two conceptual axes: Goal Clarity (Clear vs. Not Clear) and Solution Clarity (Clear vs. Not Clear):
- Quadrant 1 (Traditional / TPM): Both Goal and Solution are clear. Work is plan-driven, predictable, and low-complexity (e.g., standard construction or routine infrastructure).
- Quadrant 2 (Agile / APM): Goal is clear, but the Solution is partially unknown or evolving. Work is change-driven, requiring iterative discovery and frequent client feedback (e.g., custom software development).
- Quadrant 3 (Extreme / xPM): Neither Goal nor Solution is clear. High-risk, R&D-style initiatives searching for a viable outcome in short, exploratory phases (e.g., breakthrough medical research).
- Quadrant 4 (Emertxe / MPx): Solution is clear, but the Goal/application is unclear. A technology looking for an optimal business application (e.g., deploying a new AI capability across business units).
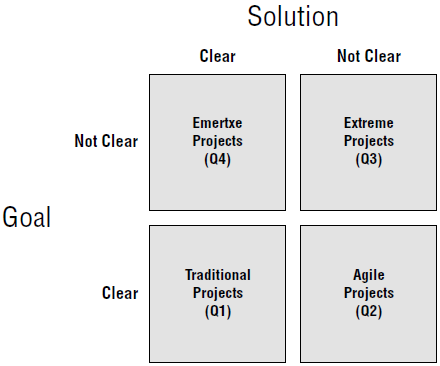
As a project progresses and requirements become clearer, its position on the landscape can shift, requiring a corresponding adaptation of the project management life cycle.
C. Formal Complexity Evaluation Models
1. The Stacey Matrix
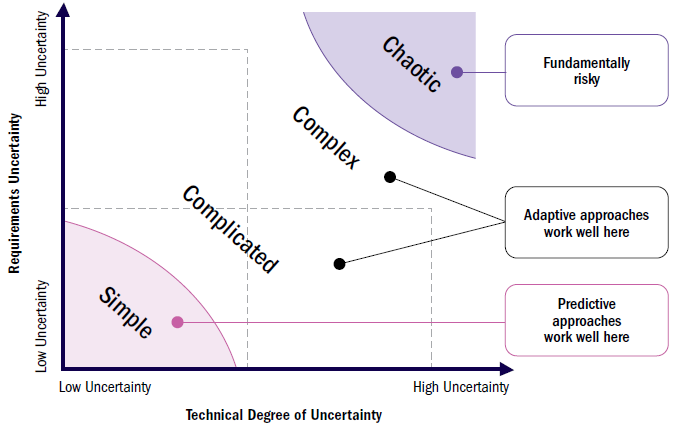
Plots Requirements Uncertainty (agreement on what is needed) against Technical Uncertainty (certainty on how to deliver it):
- Simple: Low requirements uncertainty & low technical uncertainty = Predictive approaches.
- Complicated / Complex: High uncertainty in one or both dimensions = Adaptive/Agile approaches using short feedback loops.
- Chaotic: Extreme uncertainty in both dimensions = Immediate stabilization required.
2. The Cynefin Framework
Categorizes contexts into 5 sense-making domains:
- Clear/Simple: Cause and effect are obvious; apply best practices.
- Complicated: Cause and effect require expert analysis; apply good practices.
- Complex: Cause and effect are only clear in retrospect; probe, sense, and respond using experimental, agile iterations.
- Chaotic: No clear cause-and-effect relationship; act, sense, and respond immediately to stabilize.
- Disorder / Confused: Unclear or miscategorized context.
3. Hass Complex Project Profiling (Spider Chart)
Evaluates project complexity across 10 enterprise and project factors scored on a multi-level scale:
- Time, Cost, and Size
- Team Composition and Performance
- Urgency and Flexibility of Scope, Time, and Cost
- Clarity of Problem, Opportunity, and Solution
- Requirements Volatility and Risk
- Strategic Importance, Political Implications, and Multiple Stakeholders
- Level of Organizational Change
- Risks, Dependencies, and External Constraints
- Level of IT Complexity
- Cultural & Social Dynamics.
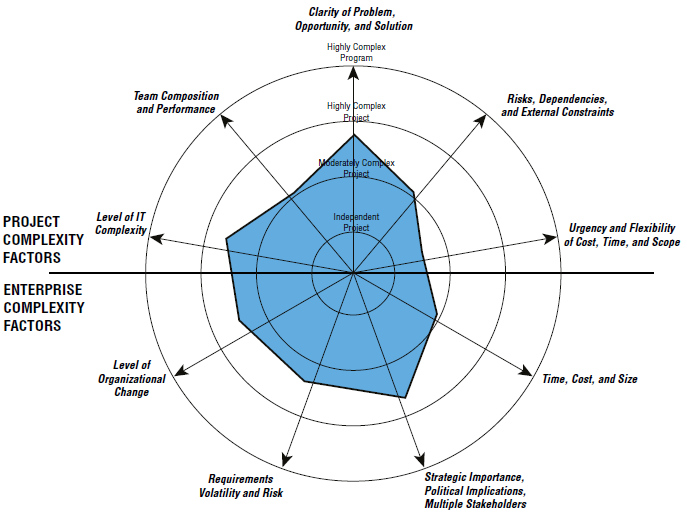
Plotting these factors on a radar chart visually alerts project leaders to specific complexity drivers that demand targeted governance or risk mitigation strategies.
3. Dimension 3: Assessing Project Magnitude
Magnitude evaluates the physical and organizational scale of a project, including budget size, duration, resource volume, cross-functional footprint, and strategic criticality.
A. Project Classification Frameworks
Organizations establish rules to categorize projects by magnitude, dictating how much process rigor and oversight must be applied:
1. Wysocki’s Project Classes (Types A–D)
| Project Class | Duration | Risk Level | Complexity | Technology | Likelihood of Problems | Process Rigor Required |
|---|---|---|---|---|---|---|
| Type A | > 18 months | High | High | Breakthrough | Certain | Full methodology & all tools mandatory |
| Type B | 9–18 months | Medium | Medium | Current | Likely | Most tools and methods required |
| Type C | 3–9 months | Low | Low | Best of breed | Some | Streamlined; optional tools at PM discretion |
| Type D | < 3 months | Very Low | Very Low | Practical | Few | Minimal documentation and lightweight tracking |
2. Kerzner’s Industry & Structural Classification
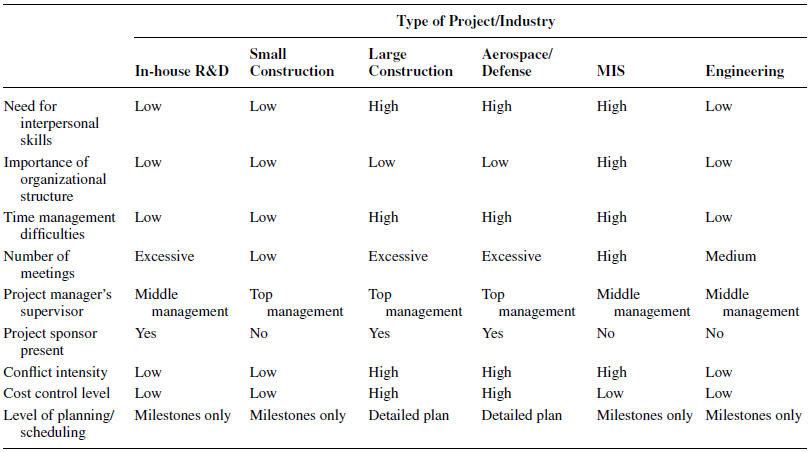
Kerzner classifies project attributes (such as interpersonal skill requirements, cost control rigor, and sponsor presence) across small/large construction, aerospace/defense, MIS, and engineering endeavors. He establishes that rigid governance is required for large projects with high task interdependencies, whereas flexible, lightweight governance fits smaller, co-located efforts.
B. Mega Projects
When project magnitude reaches extraordinary thresholds, projects enter the domain of Mega Projects. Characterized by 25 distinct attributes (developed by Virginia Greiman), mega projects feature long durations, massive public scrutiny, complex financing, intense regulatory oversight, and major socioeconomic impacts:
- Long duration
- Scale and dimension
- Type of industry and purpose
- Design and construction complexity
- Sponsorship and financing
- Life cycle
- Long, complex, and critical front end
- High public profile
- Public scrutiny
- Pursuit of large-scale policymaking
- Project delivery and procurement
- Continuity of management
- Technology and procedural complexity
- Organizational structure
- High degree of regulation
- Multiple stakeholders
- Dynamic governance structures
- Ethical dilemmas and challenges
- Consistent cost underestimation and poor performance
- Risk management in complex projects
- Socioeconomic impacts
- Cultural dimension
- Systems methodology complexity
- Environmental impact
- Collaborative contracting, integration, and partnering
They require specialized governance structures (such as dedicated Project Support Offices), continuous organizational restructuring across phases, and collaborative contracting frameworks.
C. Magnitude Impact on Estimating Ranges
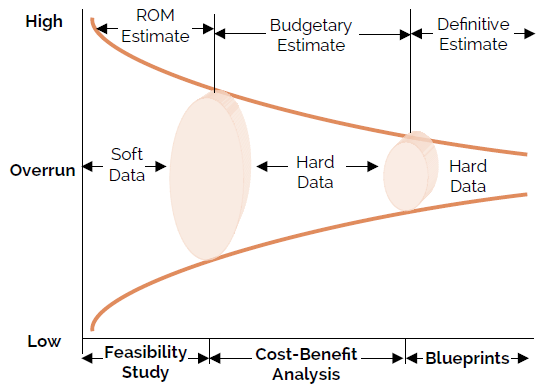
As project magnitude and uncertainty increase, the precision of initial cost and schedule estimates changes across the life cycle:
- Rough Order of Magnitude (ROM) Estimate: Prepared during feasibility/initiating phases with limited data. Typical accuracy ranges from -25% to +75% (or >35% variance).
- Budgetary / Appropriation Estimate: Prepared during planning with preliminary engineering data. Typical accuracy ranges from -10% to +25% (or ±15-20%).
- Definitive Estimate: Prepared once work packages, blueprints, and vendor quotes are finalized. Typical accuracy ranges from -5% to +10% (or ±5%).
4. Dimension 4: Selecting and Tailoring the Delivery Approach
Once needs, complexity, and magnitude are fully assessed, the project manager uses this synthesis to select and tailor the delivery approach.
A. The PMBOK® Guide (8th Edition) 4-Step Tailoring Process
Tailoring is the deliberate adaptation of project management governance, life cycles, and processes to fit the specific environment.
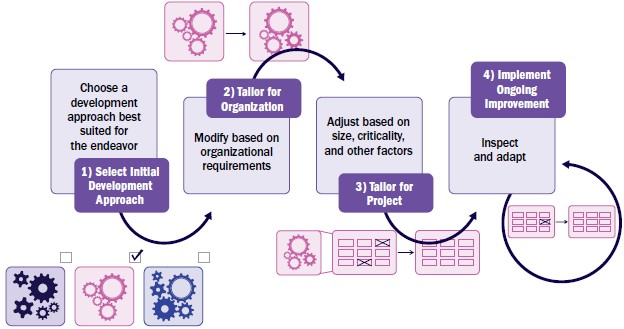
- Select Initial Development Approach: Choose Predictive, Adaptive, or Hybrid based on product characteristics, delivery cadence, and complexity models.
- Tailor for the Organization: Adjust the approach to align with organizational governance, regulatory requirements, and enterprise culture.
- Tailor for the Project: Customize processes based on product attributes (standards compliance, technology stability, requirements volatility, security) and team dynamics.
- Implement Ongoing Improvement: Continuously inspect and adapt processes throughout the project life cycle.
B. The Agile Suitability Filter
To facilitate objective discussions with stakeholders regarding life cycle selection, teams use diagnostic tools like the Agile Suitability Filter. The tool evaluates 9 parameters scored on a scale from 1 to 10 across three categories:
- Project Factors: Requirements Clarity/Changes, Product Criticality.
- Team Factors: Team Size, Agile Experience, Access to Customer/Sponsor.
- Organizational Culture: Executive Buy-In, Cultural Trust.
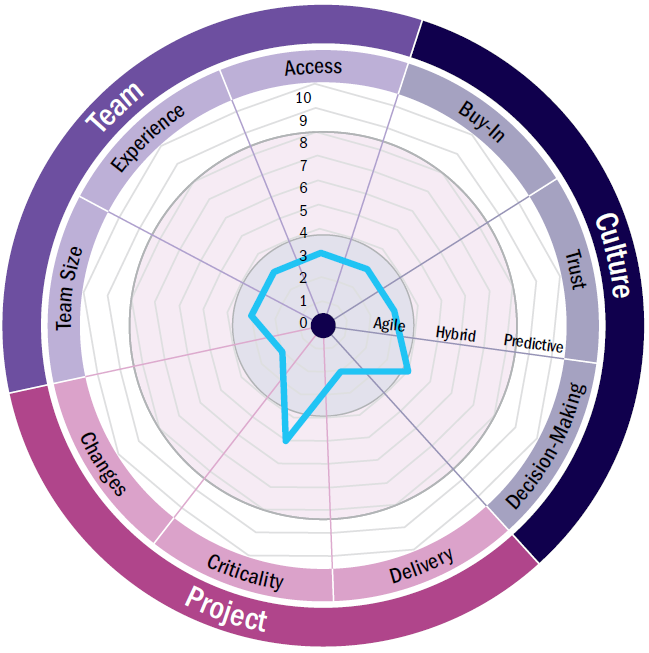
When scores are plotted on a radar chart:
- Central Clustering (near center): Indicates a strong fit for an Agile/Adaptive approach.
- Peripheral Clustering (near outside edge): Indicates a fit for a Predictive approach.
- Middle / Spiked Distribution: Indicates a Hybrid approach (e.g., executing agile development followed by a predictive rollout).
C. The Inverted Triangle Concept
Tailoring also defines how baseline constraints are governed:
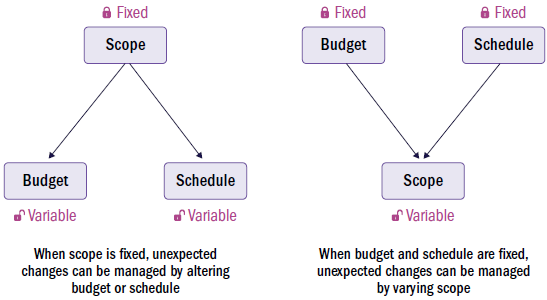
- Predictive Fixed Triangle: Scope is fixed up front; Budget and Schedule are variable and adjusted to deliver the defined scope.
- Adaptive Inverted Triangle: Budget and Schedule (timeboxes) are fixed; Scope is variable and prioritized to deliver maximum business value within the set parameters.
5. Summary & PMP Exam Synthesis
For PMP candidates, understanding “Assess project needs, complexity, and magnitude” requires synthesizing these concepts into practical decision-making guidelines:
| Assessment Dimension | Core Focus | Key Tools & Artifacts | Primary Outcome |
|---|---|---|---|
| 1. Project Needs | Business value, root problem/opportunity, alignment to strategy. | Conditions of Satisfaction (COS), RBS, Value Breakdown Structure (VBS). | Separates wants from needs; establishes value-based success criteria. |
| 2. Project Complexity | Goal & Solution clarity, requirements/technical uncertainty, systems interdependencies. | Scope Triangle, 4-Quadrant Landscape, Stacey Matrix, Cynefin Framework, Hass Spider Chart. | Identifies level of process flexibility required; drives choice between TPM, APM, xPM, and MPx. |
| 3. Project Magnitude | Size, cost, duration, team footprint, industry criticality, mega-project attributes. | Wysocki Types A–D, Kerzner Classification Tables, Classes of Estimates (ROM to Definitive). | Establishes governance threshold, estimating accuracy expectations, and resource oversight. |
| 4. Delivery Approach | Tailoring governance, life cycles, and processes to fit context. | PMBOK 4-Step Tailoring Process, Agile Suitability Filter Radar Chart, Inverted Triangle. | Establishes the tailored delivery framework (Predictive, Adaptive, or Hybrid) for the integrated project plan. |
💡 Key PMP Exam Takeaway: When exam questions present scenarios where a project faces unexpected scope creep, budget overruns, or stakeholder dissatisfaction, the root cause often traces back to inadequate assessment of needs, complexity, or magnitude during initiation. Always evaluate and analyze before acting—use suitability filters, complexity profiling, and value mapping to tailor the project management plan before committing resources to execution.